Looker by Google Cloud: A Unified Business Intelligence Platform
Beyond the ‘Dashboards are Dead’ Rhetoric: Part 4
Evolution
Compared to other players in this field, Looker is one of the most modern candidates. It was founded in 2012 in California and, like many others, looked to simplify processing data and getting business insights faster and more effectively. While others focus on other areas, such as the visualization layer and drag-and-drop capabilities, Looker focused on the developer persona and looked for ways to simplify the querying process when SQL was accessible to fewer technical practitioners.
Looker was also the first to identify the rise of new-age vertical databases and cloud data warehouses and, therefore, based its technological growth on these solutions, while others invested heavily in in-memory technologies to get faster results.
In 2020, Google finalized its $2.6 billion acquisition of Looker. Since then and up to date (2023 report), Looker has been recognized as a Challenger in the Gartner Magic Quadrant for Analytics and BI Platforms.
Technology and Architecture
Installation & applications
Looker offers a pure SaaS solution, so it provides only a web interface for its users to interact with the tool.
Querying Data
Looker is the only tool I’ve evaluated that suggests only a live querying option against its data source.
Structure, Entities & Relationships
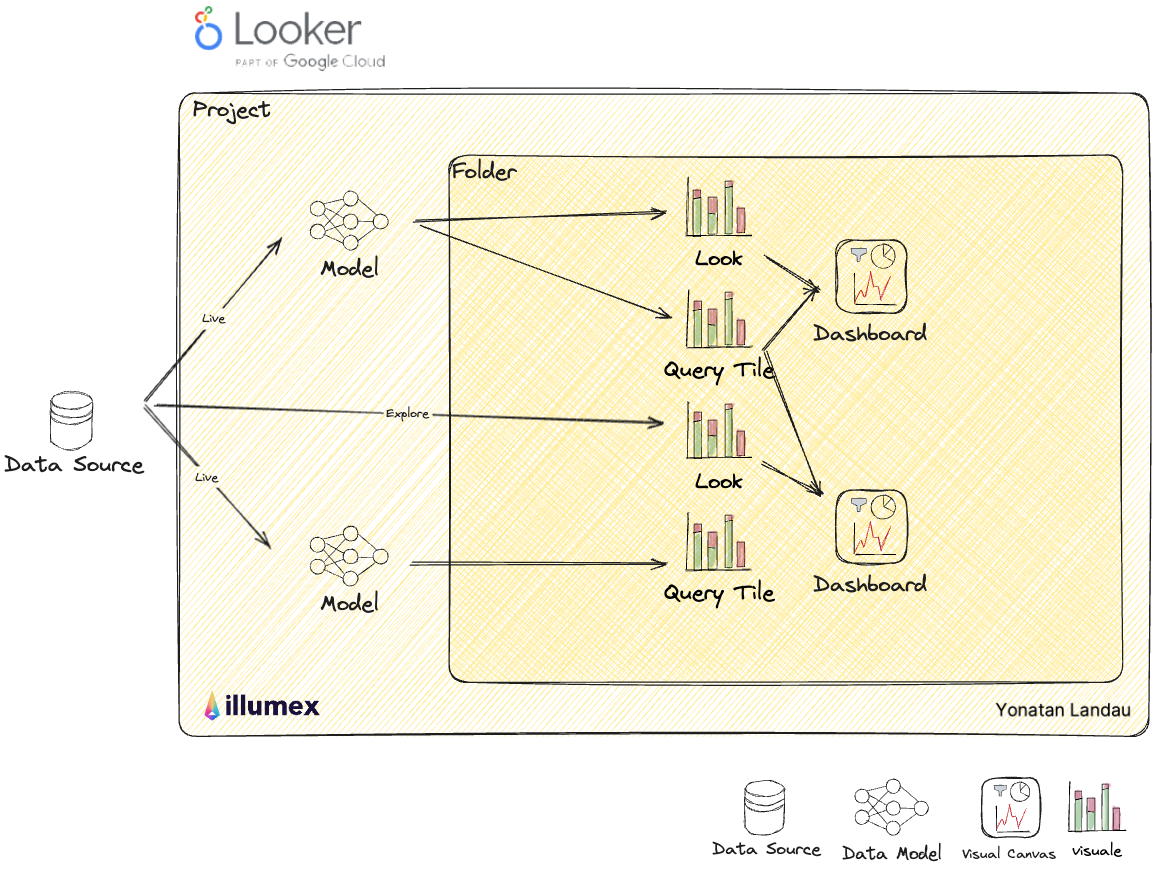
Every Looker interaction starts with a project. Once a user creates a project, they can connect to a data source directly by either designing a data model leveraging Looker’s proprietary language, LookML, to support dashboards and other visualization for a wide audience or via Explore, which is more suitable for self-use, ad hoc analysis, data exploration, testing, and sampling.
In both cases, a user can create Looks and Query Tiles that present a query result visually in a Looker Dashboard in the form of charts, tables, graphs, etc. The dashboard can include Looks and Tiles from various Data Models or directly from Explore and can also contain other tiles, such as images, texts, filters, and more.
Dashboards Tabs
Looker dashboard is a single-page canvas of visualizations and other tiles.
Containers & Organizations
Similar to Tableau, Looker works under projects, as mentioned above. But unlike Tableau, Looker separates data models into Folders, which contain Looks, Tiles, and Dashboards.
Diagram

Focus and Strengths
Targeting a niche market, Looker has excelled in embedding analytics within other products, a strategy that resonates well with development teams. By integrating its code-centric modeling layer, LookML, with Google’s suite of tools (Looker Studio, Google Sheets) and providing native integrations with Tableau and Power BI, Looker reinforces its position within the developer ecosystem. Leveraging Google Cloud Platform (GCP) tools such as BigQuery ML and Vertex AI, Looker extends its functionality, promising further innovation and integration within the GCP ecosystem.
For me, another strength that surprisingly is still unique to Looker is the Explore feature, which addresses the common need for quick ad hoc analysis, testing, data validation, and experiments. Other than getting fast answers to non-expected questions and exploring data faster, it provides a shortcut to get to an MVP of a preliminary visualization that later on can save time for greater insight. The solution it provides was definitely designed for this purpose and is still unique in that sort.
The Future
Looker got into the game at a very good time when they didn’t need to deal with desktop applications. They made great decisions not to compete in the in-memory market and rely on the rise of the cloud, specifically on cloud DWHs. Most importantly, they focused on a very specific persona and, by that, on a specific market (Product Development and Embedded Analytics).
However, the evolving landscape, characterized by the rise of open-source platforms and competitors targeting similar markets, poses challenges to Looker’s continued uniqueness. According to Gartner, they are in the wrong quartile by the Completeness of Vision axes (even though they are not too far from the center). In addition, there is a lack of competitive edge for business data consumers.
Despite these challenges, Looker’s position within Google offers potential pathways for growth, particularly by further integrating with GCP to offer distinct advantages over competitors. As Looker continues to evolve, its trajectory will likely hinge on leveraging its Google partnership to enhance its offering in the analytics space.
Catch Up on the Other Blogs in This Series
- Read more about the objective of this series of articles: to compare business intelligence vendors’ existing offerings and their take on the future impact of AI/GenAI.
- Read my take on Tableau in part 2.
- Examine Microsoft Power BI in part 3.
- Take a look at Google Looker in part 4.
- Read my thoughts on ThoughtSpot in part 5.
- Learn about Sisense in part 6.
- See my take on Amazon QuickSight in part 7.
- Conclude the journey with insights about the Resilience and Revolution of Business Intelligence In the Age of GenAI.


