


Tableau: Helping People See, Understand, and Act on Data
Beyond the ‘Dashboards Are Dead’ Rhetoric: Part 2
Evolution
Originating from French, the word Tableau stands for a picture, and as its name suggests, Tableau’s main mission has been to visualize data since it was founded at Stanford in 2003. With the introduction of its proprietary VizQL language, Tableau revolutionized the field by seamlessly blending SQL queries with visual analysis. Tableau was a pioneer in the data visualization and self-service analytics market and focused a lot on its user experience – both in terms of its contributors and consumers.
After several acquisitions, Tableau was acquired by the technology giant Salesforce in an all-stock deal worth over $15 billion. Since 2013, Tableau has been recognized as a market leader at the “Gartner Magic Quadrant for Analytics and Business Intelligence Platform” for 11 consecutive years.
Technology and Architecture
Installation & applications
Tableau provides a versatile suite of solutions, accommodating both on-premises and cloud-based deployments. Its ecosystem includes Tableau Cloud, for web-based analytics; Tableau Desktop, for in-depth data exploration and visualization creation; and Tableau Server, for enterprise-grade deployment and governance.
Querying Data
Tableau empowers users with dual data handling capabilities: a Live Database Connection for real-time data analysis, and the Extract feature, which leverages Tableau Hyper — an in-memory data engine that optimizes data extraction and storage. Users can craft custom SQL queries, merge tables, and integrate advanced logic, catering to diverse analytical needs.
In addition, Tableau provides the capability to join or blend data from these different sources at the worksheet level.
Structure, Entities & Relationships
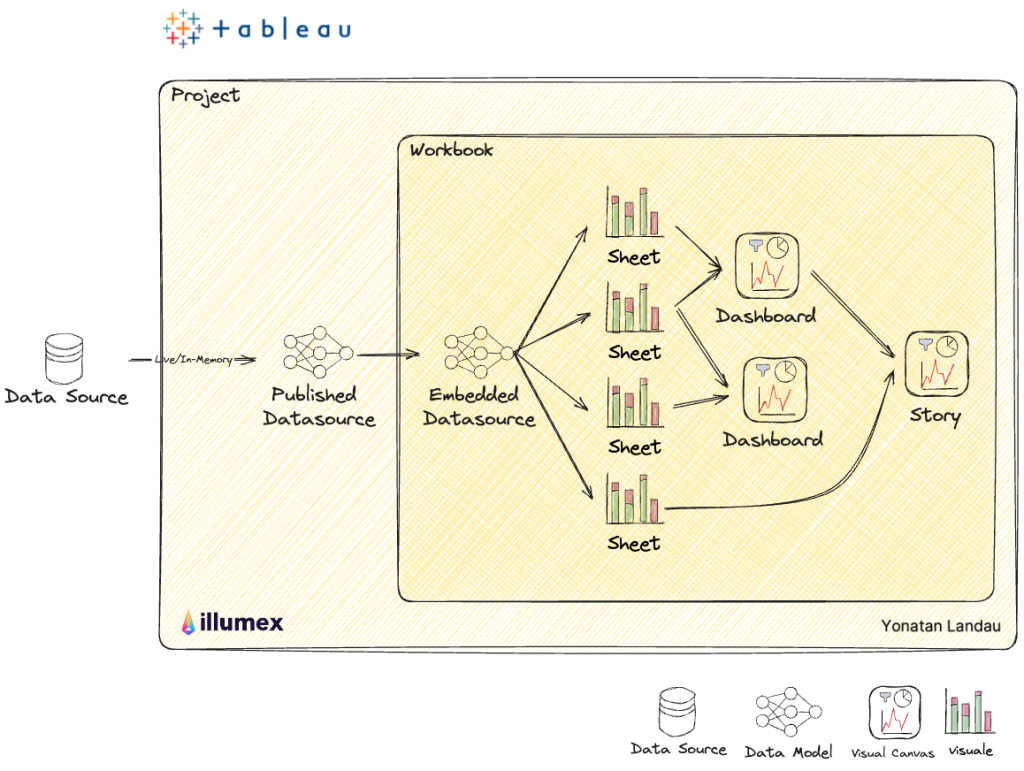
Tableau gathers the data to a published data source where a user can add custom SQL tables. From there, under each workbook a user can make a sub-version of the published data source, called embedded data source where they can apply additional logic in the form of custom SQL tables and calculated fields. With the embedded data source, a user can create sheets in which each sheet represents a single visualization. In each workbook, there is a repository of visuals (sheets) that a user can select from into a dashboard they create. One dashboard is assembled by one or more visuals, and one visual can be related from 0 to many dashboards.
Finally, a user can also create a story, in case they want to combine different dashboards and individual sheets into one canvas to have a full picture around a specific use case.
Dashboards Tabs
Tableau dashboards can feature multiple tabs, organizing related visualizations for ease of access and interpretation. Conversely, a Story in Tableau is a singular, linear narrative that threads together a sequence of visualizations to articulate a data-driven story, enhancing the viewer’s understanding and engagement.
Containers & Organizations
Tableau’s user environment is structured as a hierarchical, folder-based system, facilitating organized data analysis. At the top level are projects, which encompass all components related to a specific analytical objective or dataset, including public data sources, workbooks (with embedded data sources, sheets, dashboards, and stories), and more. A user can create sub-projects for further segment-specific topics. This organization enables users to segregate and concentrate on relevant analyses, streamlining focus and enhancing clarity for both analysts and their audience.
Diagram
Focus and Strengths
As mentioned above, Tableau is all about visualization. It became a standard for data visualization and a comparison factor. More than that, as Tableau is one of the pioneers of this space, it has created a massive community of visual analytic developers that influence ABI buying decisions.
From an analytics perspective, their user-centric design improves multi-persona collaboration within the tool, expanding its adoption by more business users.
In terms of flexibility, even with the Salesforce acquisition, Tableau remains agnostic to clouds, data sources, and applications, which can be more appealing than some of its competitors.
The Future
It will be interesting to see how Salesforce will navigate Tableau within its strategic plans. One can only imagine how questions about the business can be addressed while typing them in Slack, getting through Tableau’s predefined data models, querying the Salesforce app accordingly, and getting back to Slack with the figures presented in a nice piece of visualization. That being said, as Tableau is being used over many data sources and for endless use cases, focusing too much on Salesforce use cases could push other users away to the alternatives that remain technology/data source/ industry/ use case agnostic.
While it is a fine line to walk on, Tableau has the right cards to step ahead in the game.
Catch Up on the Other Blogs in This Series
- Read more about the objective of this series of articles: to compare business intelligence vendors’ existing offerings and their take on the future impact of AI/GenAI.
- Read my take on Tableau in part 2.
- Examine Microsoft Power BI in part 3.
- Take a look at Google Looker in part 4.
- Read my thoughts on ThoughtSpot in part 5.
- Learn about Sisense in part 6.
- See my take on Amazon QuickSight in part 7.
- Conclude the journey with insights about the Resilience and Revolution of Business Intelligence In the Age of GenAI.